Seasonal Effects on Stalling Mortality in England
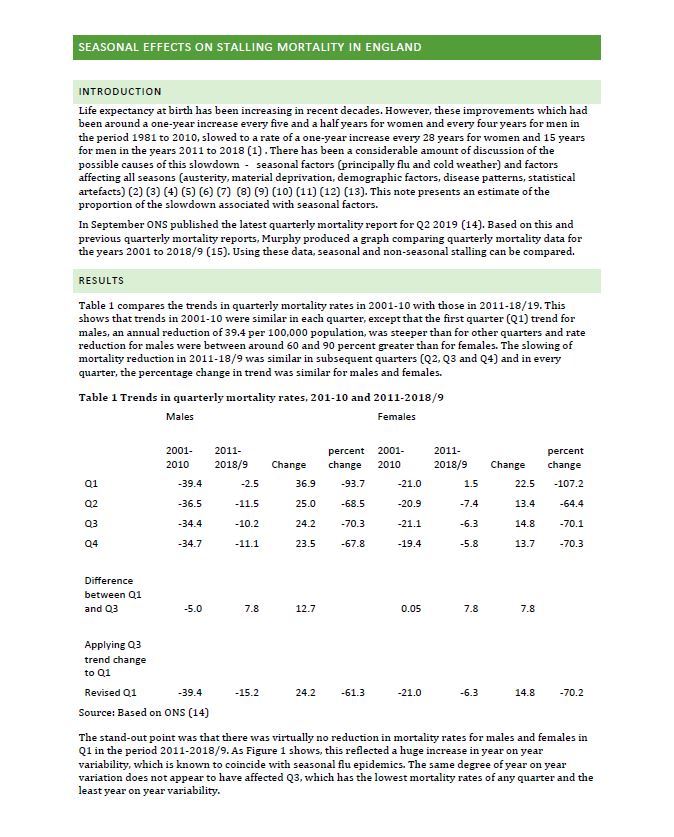
Life expectancy at birth has been increasing in recent decades. However, these improvements which had been around a one-year increase every five and a half years for women and every four years for men in the period 1981 to 2010, slowed to a rate of a one-year increase every 28 years for women and 15 years for men in the years 2011 to 2018. There has been a considerable amount of discussion of the possible causes of this slowdown - seasonal factors (principally flu and cold weather) and factors affecting all seasons (austerity, material deprivation, demographic factors, disease patterns, statistical artefacts). This note presents an estimate of the proportion of the slowdown associated with seasonal factors.
In September ONS published the latest quarterly mortality report for Q2 2019. Based on this and previous quarterly mortality reports, Murphy produced a graph comparing quarterly mortality data for the years 2001 to 2018/9. Using these data, seasonal and non-seasonal stalling can be compared.
Updated March 2020
Since 2011, there has been a slowing down of the improvements in mortality rates seen in the previous decade in every season of the year. In the winter months of 2011-2019, there was increased variability in mortality - both in size and frequency of changes in rates associated with the presence or absence of flu epidemics and cold spells. This resulted in a stalling of improvements in winter mortality.
However this winter stalling accounted for less than 20 percent of the slowdown in improvements. Other factors accounted for over 80 per cent of the slowdown.

